Insights
The loading experience is the product
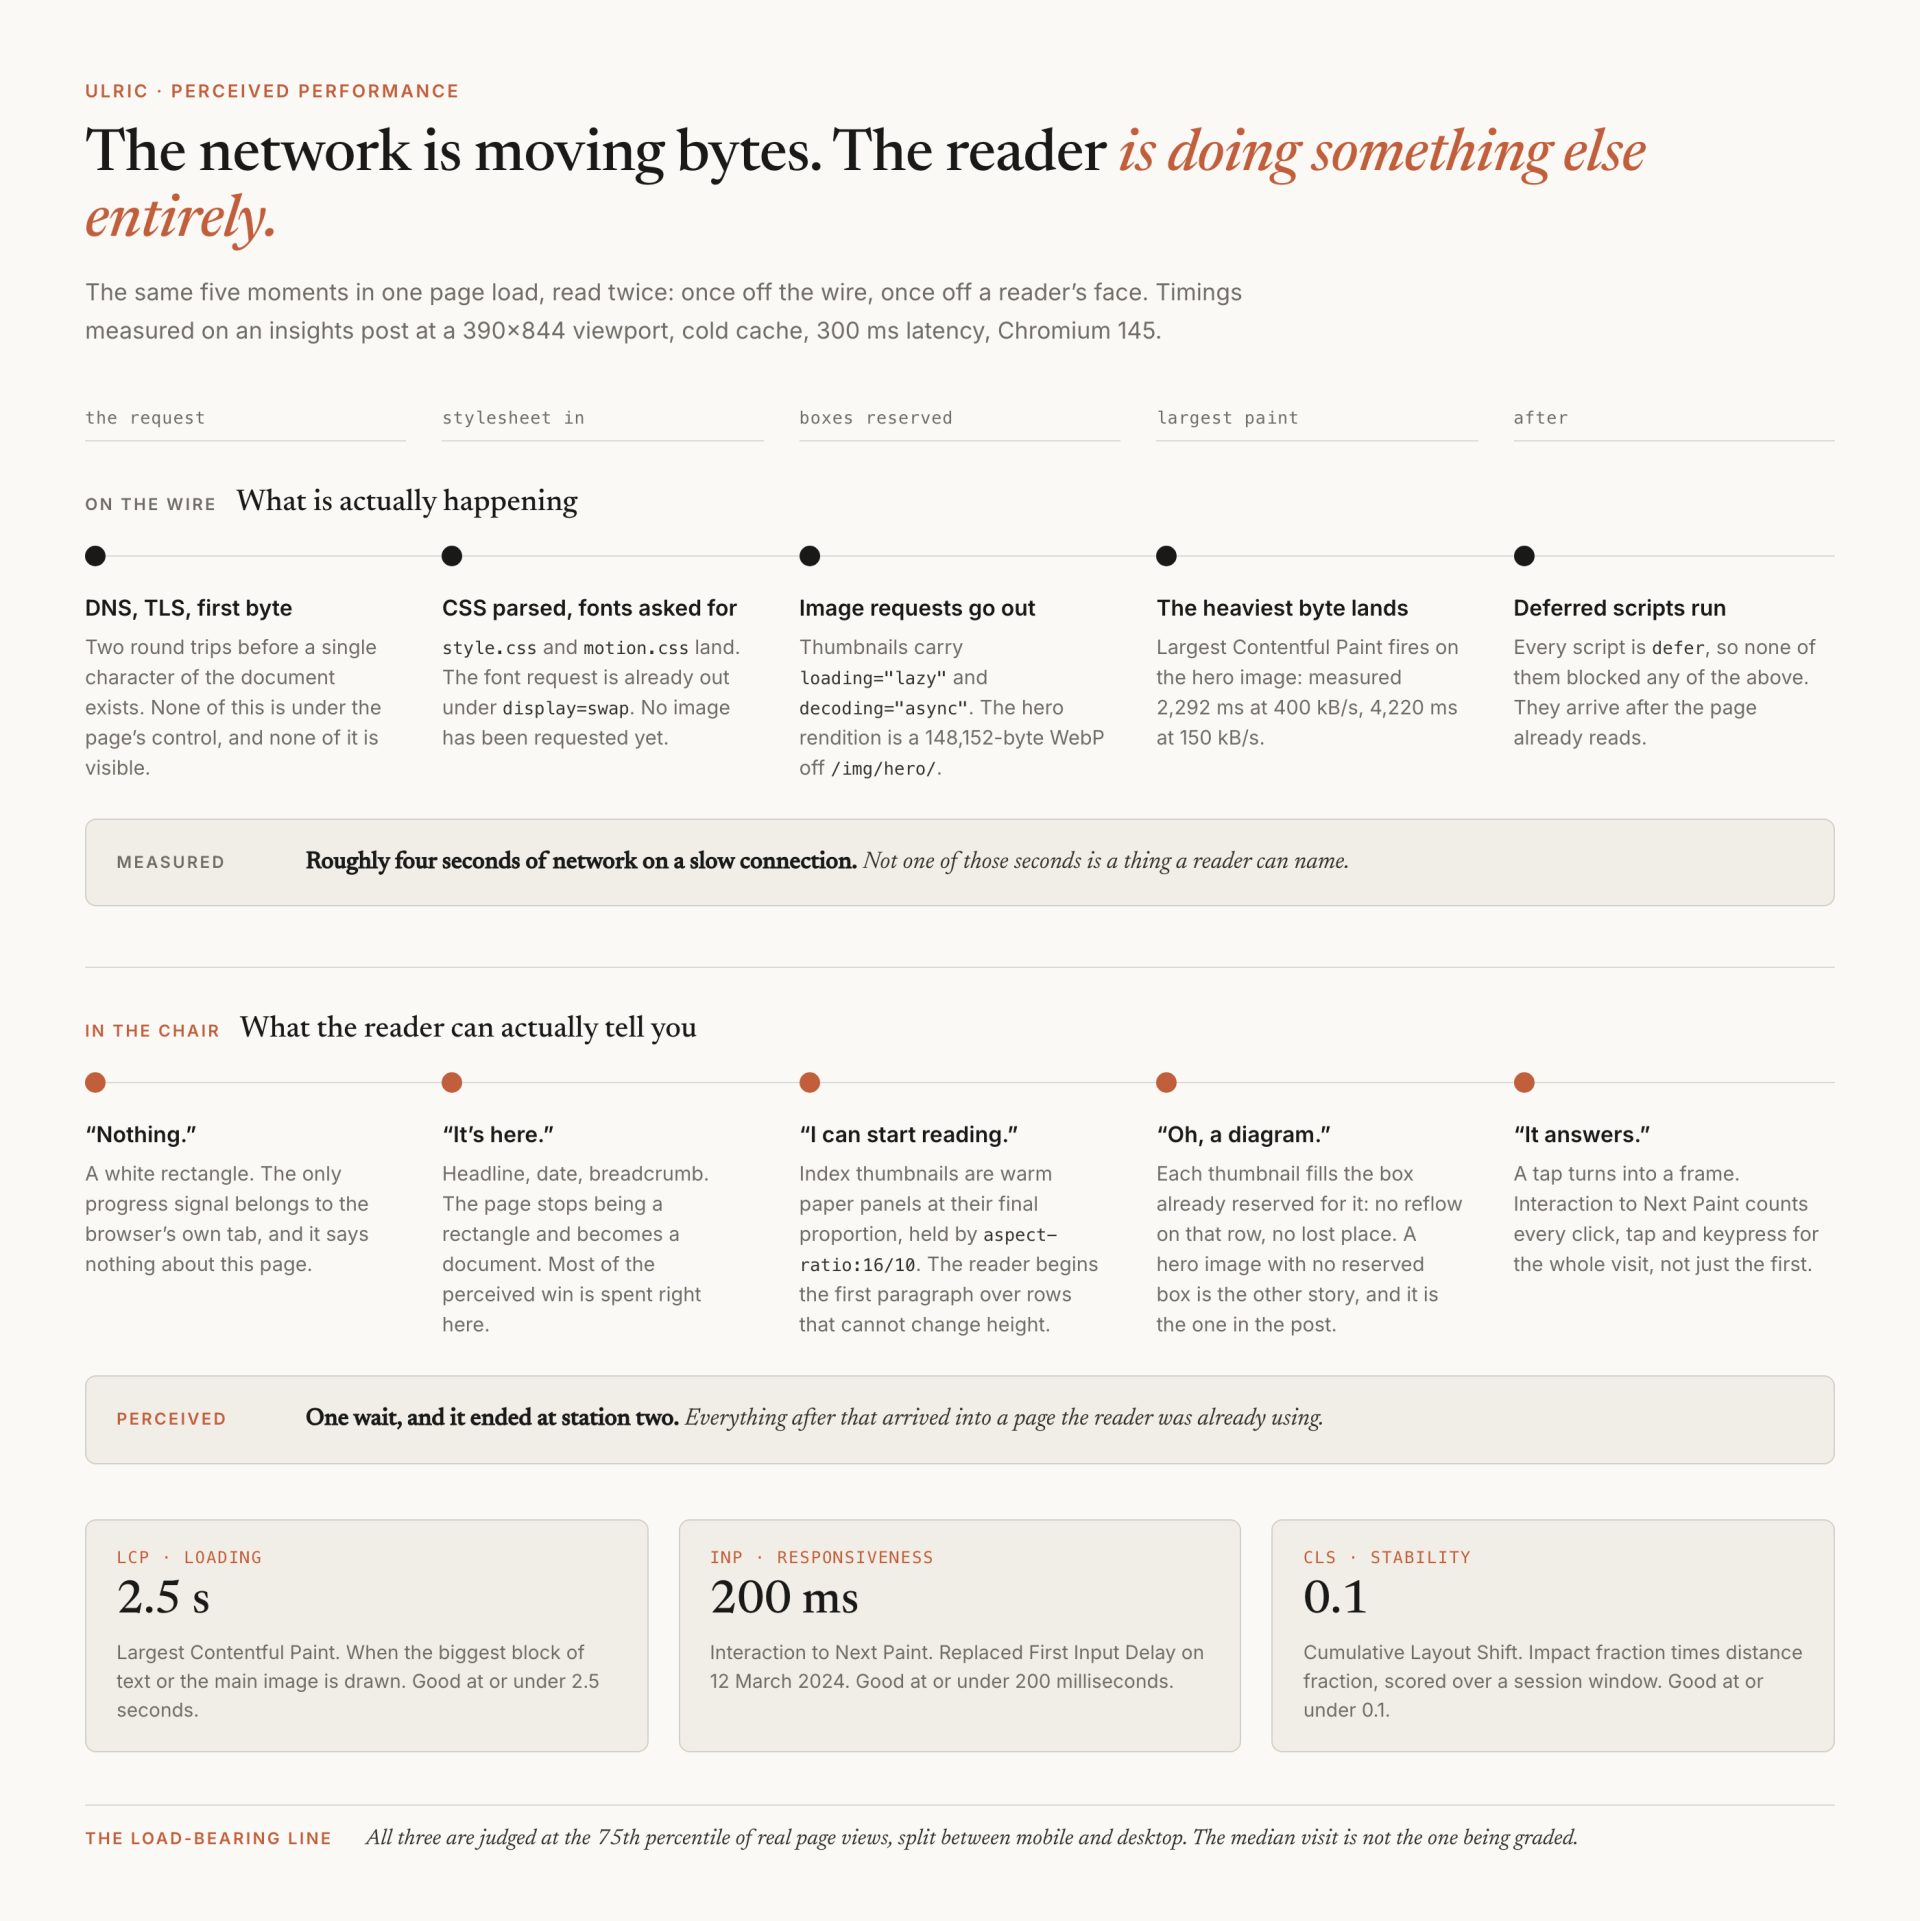
Nobody has ever experienced a millisecond. Readers experience waiting, which is a different quantity measured on a different instrument, and the gap between the two is the whole subject of perceived performance on the web. This is about treating that gap as a material you design with: the poster frame, the reserved box, the progress readout that has to earn its number, and the moment an interface starts telling a small lie to look quick.
Two files sit next to each other in this repository. One of the scroll-scrub films on my products page is 8,310,726 bytes. Its poster frame is 42,046 bytes. On most visits the poster is the only one of the two ever seen, and on every visit it is what a reader looks at for the whole time the film is arriving. Half of one percent of the bytes carries nearly all of the experience.
That ratio is the argument. What follows is what I could verify about the rest, including two places where the research does not say what people say it says, and one defect I found in my own theme while measuring for this post.

What do the Core Web Vitals actually measure in 2026?
Three things, and not one of them is how long the page took.
Largest Contentful Paint asks when the biggest block of text or the main image finished drawing, and Google's threshold for good is 2.5 seconds or less. Cumulative Layout Shift asks how far the page moved under the reader, and good is 0.1 or less. Interaction to Next Paint asks how long a tap takes to become a frame, and good is 200 milliseconds or less. All three are graded at the 75th percentile of real page views, split between mobile and desktop, so the visit being judged is never the median one.
The part I checked rather than assumed: INP replaced First Input Delay on 12 March 2024, and Chrome stopped supporting FID in its own tools on 10 September 2024, dropping the first_input struct from the CrUX BigQuery schema in the 202409 dataset. Nothing has replaced INP since. What is moving in 2026 is the Soft Navigations origin trial, running Chrome 147 through 149, which measures the same three metrics across single-page-app route changes rather than adding a fourth. The Chrome team is careful about what the trial is not: "This origin trial is to evaluate the new API and not how this data will be used in CrUX or tooling."
INP is the one most often described loosely, so here it is in web.dev's own words:
INP is a metric that assesses a page's overall responsiveness to user interactions by observing the latency of all click, tap, and keyboard interactions that occur throughout the lifespan of a user's visit to a page.
Every interaction, the whole visit, not the first one. Scrolling, hovering and zooming are not counted at all.
Is a skeleton really better than a spinner?
The honest answer is that the evidence does not say, and the confident version you have read a hundred times is one study quoted without the other one.
| Study | Design | What it found |
|---|---|---|
| Viget, October 2017 | 136 people, three treatments of identical length | Perceived wait: skeleton 2.82 s, spinner 2.41 s, blank 2.29 s. Skeleton lost on every measure. |
| Mejtoft, Langstrom and Soderstrom, ECCE 2018 | Two versions of a fictional news site | Skeleton scored higher on perceived speed and ease of navigation. Spinner users found the article faster. No statistical significance. |
| Ziat and colleagues, Scientific Reports, June 2022 | Four experiments, 20 / 11 / 21 / 16 participants | More steps read as faster progress. Fewer, larger steps dilate perceived time. |
The Viget test put 39 people in front of a skeleton, 39 in front of a spinner and 58 in front of a blank screen, holding the real duration constant. Kathryn Faulkner and Katherine Olvera concluded that "the skeleton screen performed the worst by all metrics." The following year Thomas Mejtoft, Arvid Langstrom and Ulrik Soderstrom ran the comparison again and got the opposite headline. Their abstract then closes on the sentence that almost never travels with the citation:
The results of this paper cannot show any significant differences in any of the comparisons between the web pages.
So the two most-cited studies disagree, and the one that favors skeletons found no significant difference. Anyone selling you a skeleton on the strength of the literature is selling you a preference. I use skeleton-shaped placeholders anyway, for a reason that has nothing to do with perceived speed: a box that is already the right size cannot shift.
What does have support is narrower and more useful. Ziat and colleagues found that a "higher number of steps produced the impression of a faster progression leading to an underestimation of time, whereas a progression in large fewer steps, produced slower apparent progression." Their samples are small, but they line up with Chris Harrison's 2007 progress-bar experiment, 22 participants, every bar held at exactly 5.5 seconds:
First, participants perceived progress bars with pauses as taking longer to complete (peak effect). Secondly, accelerating progress was strongly favored. The latter two effects had an exaggerated perceptual impact when located towards the end of the process (end effect).
Both point the same way. Many small increments read as faster than the same distance covered in a few jumps, and a stall near the end costs more than one near the start. I built the loading gate on my scrub theme before reading either paper, and it happens to obey both:
/* the readout eases toward the real number instead of snapping, so a burst
   of cached hits still reads as motion rather than a jump to 100 */
(function tick() {
  if (settled) return;
  shown += (target - shown) * .12;
  var v = Math.round(shown * 100);
  rail.style.transform = 'scaleX(' + shown.toFixed(4) + ')';
  pct.textContent = v < 10 ? '0' + v : String(v);
  requestAnimationFrame(tick);
})();
The percentage never snaps and never stalls, because it chases the true value rather than reporting it. Worth naming as the small dishonesty it is: the number on screen is always slightly behind the number in memory.
The part of that file I would defend harder is its ceiling. A gate that can trap someone is worse than no gate at all, so it opens after four seconds whether the world reported in or not, and the shared motion engine carries the same idea in three lines of inline script:
<script>document.documentElement.className+=" js fx";
setTimeout(function(){if(!window.__ulricMotion)
document.documentElement.classList.remove("fx")},3000);</script>
Three seconds in, if the motion script has not reported for duty, the class that hides content for the reveal comes off and the page is simply there. An invisible page is a worse outcome than a slow one, and invisible is exactly how a loading treatment fails.
Why does the poster frame matter more than the bitrate?
Because the poster is the only frame most visitors will ever see. This is the real markup behind the scroll-scrubbed film cards, minus the PHP and two attributes that do no work here:
<video class="scrubfilm" muted playsinline preload="metadata"
       poster="…-poster.webp" aria-hidden="true">
  <source src="…-800.mp4"  type="video/mp4" media="(max-width: 700px)">
  <source src="…-1280.mp4" type="video/mp4">
</video>
There are two claims in those four lines that I had been taking on faith, so I measured both against the real files.
The first is preload. Against a Range-capable local server and the real 8,310,726-byte film, Chromium 145 fetched no video bytes at all under preload="none", buffered between 0.34 and 0.46 seconds of an 11.6-second film under metadata, and pulled the entire file under auto. The poster arrived in all three cases. That one attribute is the difference between a card costing 42 KB and a card costing 8.3 MB, on a page carrying several of them.
The second is the media attribute. A lot of writing from between 2014 and 2020 says browsers other than Safari ignore media on a source inside a video, which would mean every phone on that page was quietly downloading the 1280 film. On Chromium 145.0.7632.6 and WebKit 26 it is not true: at a 390-pixel viewport both engines selected the 800 file and reported videoWidth 800, and at 1400 pixels both selected the 1280 file. The real limitation is a different one, and it is why media here is not the tool it is inside a picture: neither engine re-evaluated the query after the resource had been chosen. Load at desktop width, resize to a phone, and you keep the desktop film.
Worth naming honestly: Playwright's WebKit is not Safari, least of all for media. Under preload="metadata" that build requested the whole byte range. Two engines in a harness is evidence, not proof.
What does a blur-up placeholder actually cost?
An extra request, extra bytes, and an interaction with Largest Contentful Paint that most implementations never check.
Since Chrome 112, which reached users around 6 April 2023, low-entropy images are not eligible to be your LCP element at all. From the Chromium metrics changelog:
The threshold is currently 0.05 bits of image data per displayed pixel, and images which fall below this threshold will not be considered for LCP.
The same changelog warns that LCP can get worse after the change "if a low-content placeholder was being used to reserve space for a more contentful image which loaded later," which is precisely what a blur-up is. Harry Roberts worked the arithmetic out in the clearest write-up of the technique: a placeholder displayed at 720 by 360 needs about 1.62 KB to clear the bar, and the bar counts displayed pixels, so "if you want your LQIP to be considered as your LCP, do not upscale it." A 300-byte blur stretched across a hero is invisible to the metric and still costs a request.
I do not ship LQIP here, and the reason is arithmetic rather than principle. The insights index reserves its thumbnail box like this:
.post-row .thumb{display:block;border:1px solid var(--line);background:var(--paper-2);
  border-radius:2px;overflow:hidden;aspect-ratio:16/10}
.post-row .thumb img{width:100%;height:100%;display:block;object-fit:cover}
A warm paper rectangle at the exact final proportion, for zero extra bytes and zero extra requests, and a CSS background color can never be an LCP candidate, so there is nothing to reason about. The images inside carry loading="lazy" and decoding="async". On a page built around large photography a blur-up earns its 1.6 KB. On a text-led index it does not, and I would rather spend the request on the real picture.

Behind those boxes is the pipeline above. One upload, optimized on the way in and stored once, then requested by preset name: img_url('x.png', 'hero') returns /img/hero/x.png?v=3, and the renderer writes a WebP into uploads/_cache/hero/ under public, max-age=31536000, immutable. There are 1,403 cached renditions on this machine right now, 52 MB across ten presets, each computed exactly once. The rule that pipeline learned expensively belongs to its own postmortem: an empty file left behind by a full disk is not a rendition, and a cache that only asks whether a file exists will publish the hole.
What my own layout-shift number was hiding
This is the part of the post that cost me something.
CLS scores each shift as impact fraction times distance fraction, sums them inside a session window of at most five seconds with gaps under one second, and takes the worst window. Shifts within 500 milliseconds of a real interaction are excluded, because a page that moves because you tapped something is not the problem being measured.
I measured one of my own post pages at a 390 by 844 viewport, cold cache, 300 milliseconds of latency, throttled to 150 kB/s, in Chromium 145. CLS came back 0.0000 on every one of nine loads. LCP landed at 4,220 milliseconds there and 2,292 at 400 kB/s, on the hero image both times. Those are the numbers I would have published.
Then I ran the same page with prefers-reduced-motion: reduce. CLS came back 0.0798 on seven of fifteen cold loads, the identical value every time it appeared, and the shift source was div.prose. The cause is one line of markup: the post hero image carries no width, no height and no aspect-ratio, so its box is empty until the byte lands and 248 pixels tall afterward, taking the frame around it from 45 pixels to 293. Everything below it moves.
The default run reads zero because the reveal animation holds the prose at opacity zero while the image is still arriving, and content that has not been painted does not register as a shift. My clean number was the animation covering for the layout rather than the layout being right. I proved it the other way too: rewriting the stylesheet through the harness to give that one image an aspect-ratio took CLS to 0.0000 on six loads out of six under the same conditions.
Now the limit on that number, because it matters more than the number does. The 0.0798 is one context: a 390 by 844 Chromium page, cache disabled, throttled to 150 kB/s. When I ran the identical reduced-motion test under full mobile emulation, isMobile on, device scale factor 3, overlay scrollbars instead of classic ones, the shift did not appear once in twelve loads. So this is not something every reader with reduced motion turned on is walking into. It is a real missing aspect-ratio and a real shift in the context I measured, and it did not reproduce in the context closest to an actual phone. Both halves are the finding, and the attribute went onto the template the same day regardless, because a box that reserves its own height costs nothing whether or not a metric is catching it.
Two things generalize, and neither is about images. A metric that reads clean only because something is invisible is measuring your animation, not your layout, which is the same failure mode as a verifier that checks for output instead of the right output. And a reader who has reduced motion turned on is not getting a politer version of your page. They are getting the version with the cover off.
When does an optimistic interface start lying?
At the failure path, and only there. React's own documentation describes the default behavior with unusual precision:
If the Action throws an error, the Transition still ends, and React renders with whatever
valuecurrently is. Since the parent typically only updatesvalueon success, a failure meansvaluehasn't changed, so the UI shows what it showed before the optimistic update. You can catch the error to show a message to the user.
That last sentence carries the whole weight. Catching the error is optional, and the default when you skip it is a silent revert: the checkbox checks, then unchecks a beat later, and nothing explains why. From the reader's side that is not a slow interface, it is an unreliable one, which is a far more expensive impression to leave. Every optimistic update is a promise about a request that has not finished. A promise you retract without saying so is not optimism.
The order, and it does not bend
Make it fast. Then make it feel fast. Never only the second.
The order matters because the second step has a ceiling and the first does not. Jakob Nielsen's response-time limits, written in 1993 and still the most useful thing on the subject, put the boundary at about one second for uninterrupted thought and about ten for holding attention at all. Under one second, any treatment you add is noise. Past ten, no amount of easing keeps someone in the chair. Perceived performance buys you the middle, and only the middle.
So the ranking I work to: send fewer bytes, send them in the right order, reserve every box before anything arrives, decorate the wait, and only then consider predicting the future in the interface. Skipping to the last step is how you get a product that tests beautifully and feels like it is lying, because by then it is.
What I have not settled is Safari. Everything above was measured in Chromium 145 and Playwright's WebKit 26, and those two disagreed with each other about preload="metadata" by roughly eight megabytes. Until I have run it on an actual iPhone on an actual cellular connection, the honest version of my poster-frame claim covers one engine and a lookalike.
Common questions
What are the Core Web Vitals thresholds in 2026?
Largest Contentful Paint at 2.5 seconds or less, Interaction to Next Paint at 200 milliseconds or less, and Cumulative Layout Shift at 0.1 or less, each judged at the 75th percentile of real page views and split between mobile and desktop. INP replaced First Input Delay on 12 March 2024 and nothing has replaced INP since.
Do skeleton screens really feel faster than spinners?
The published evidence does not settle it. A 2017 Viget test of 136 people found the skeleton perceived as the slowest of three treatments, and a 2018 study found the opposite but reported no statistically significant difference between the two. I use placeholder boxes for layout stability rather than for perceived speed.
Does a blur-up placeholder count as the LCP element?
Usually not. Since Chrome 112, an image carrying under 0.05 bits of data per displayed pixel is excluded from LCP candidacy, which is where most blur-up placeholders sit. A placeholder that is upscaled to fill a large box falls further below the threshold, and the changelog notes LCP can get worse after the change for exactly this pattern.
What is the real difference between preload="metadata" and preload="auto" on a video?
Measured on Chromium 145 against an 8,310,726-byte film: preload="none" fetched no video bytes, preload="metadata" buffered roughly 0.34 to 0.46 seconds of an 11.6-second film, and preload="auto" pulled the whole file. The poster frame arrived in all three cases, which is why the poster carries most of the experience.
Why did my CLS score read zero when the layout was still shifting?
Because a reveal animation was holding the content at opacity zero while the image arrived, and unpainted content does not register as a layout shift. Running the same page with prefers-reduced-motion enabled surfaced a 0.0798 shift that the default configuration never reported, on seven of fifteen cold loads at a 390 by 844 Chromium viewport throttled to 150 kB/s. Under full mobile emulation the same test did not reproduce it at all, so the scope of that finding is the context it was measured in.
Related