Insights
Most of my AI bill was re-reading my own transcript
My usage panel had a diagnosis waiting for me. Ninety-nine percent of the week's spend came from subagent-heavy sessions, it said, so be deliberate about spawning them, and consider configuring a cheaper model for the simpler ones. Specific, actionable, and I very nearly acted on it. Instead I spent twenty minutes tallying the raw transcript files, and the answer came back close to backwards.
What a token bill is actually made of
Here is the mechanism, and it took me longer than I would like to internalize properly. A conversation with a model is not a conversation. Every turn, the entire transcript is sent again. There is no memory between requests; the feeling of continuity is the whole history being re-read from the top, every single time.
Caching softens the price of that, not the fact of it. A cached re-read runs about a tenth of fresh input, which sounds like a solved problem right up until you multiply it by turns. Open a four-thousand-token file at turn nine to check one line, and you have not bought four thousand tokens. You have bought four thousand tokens on every turn from nine to the end of the session. In a thread that runs four hundred turns, that is a rounding error that grew a spine.
Seven days of my own transcripts: 8.03 billion cache-read tokens, 493 million cache-creation, 25.8 million output. For every token a model wrote for me, roughly three hundred went on re-reading what had already been written.

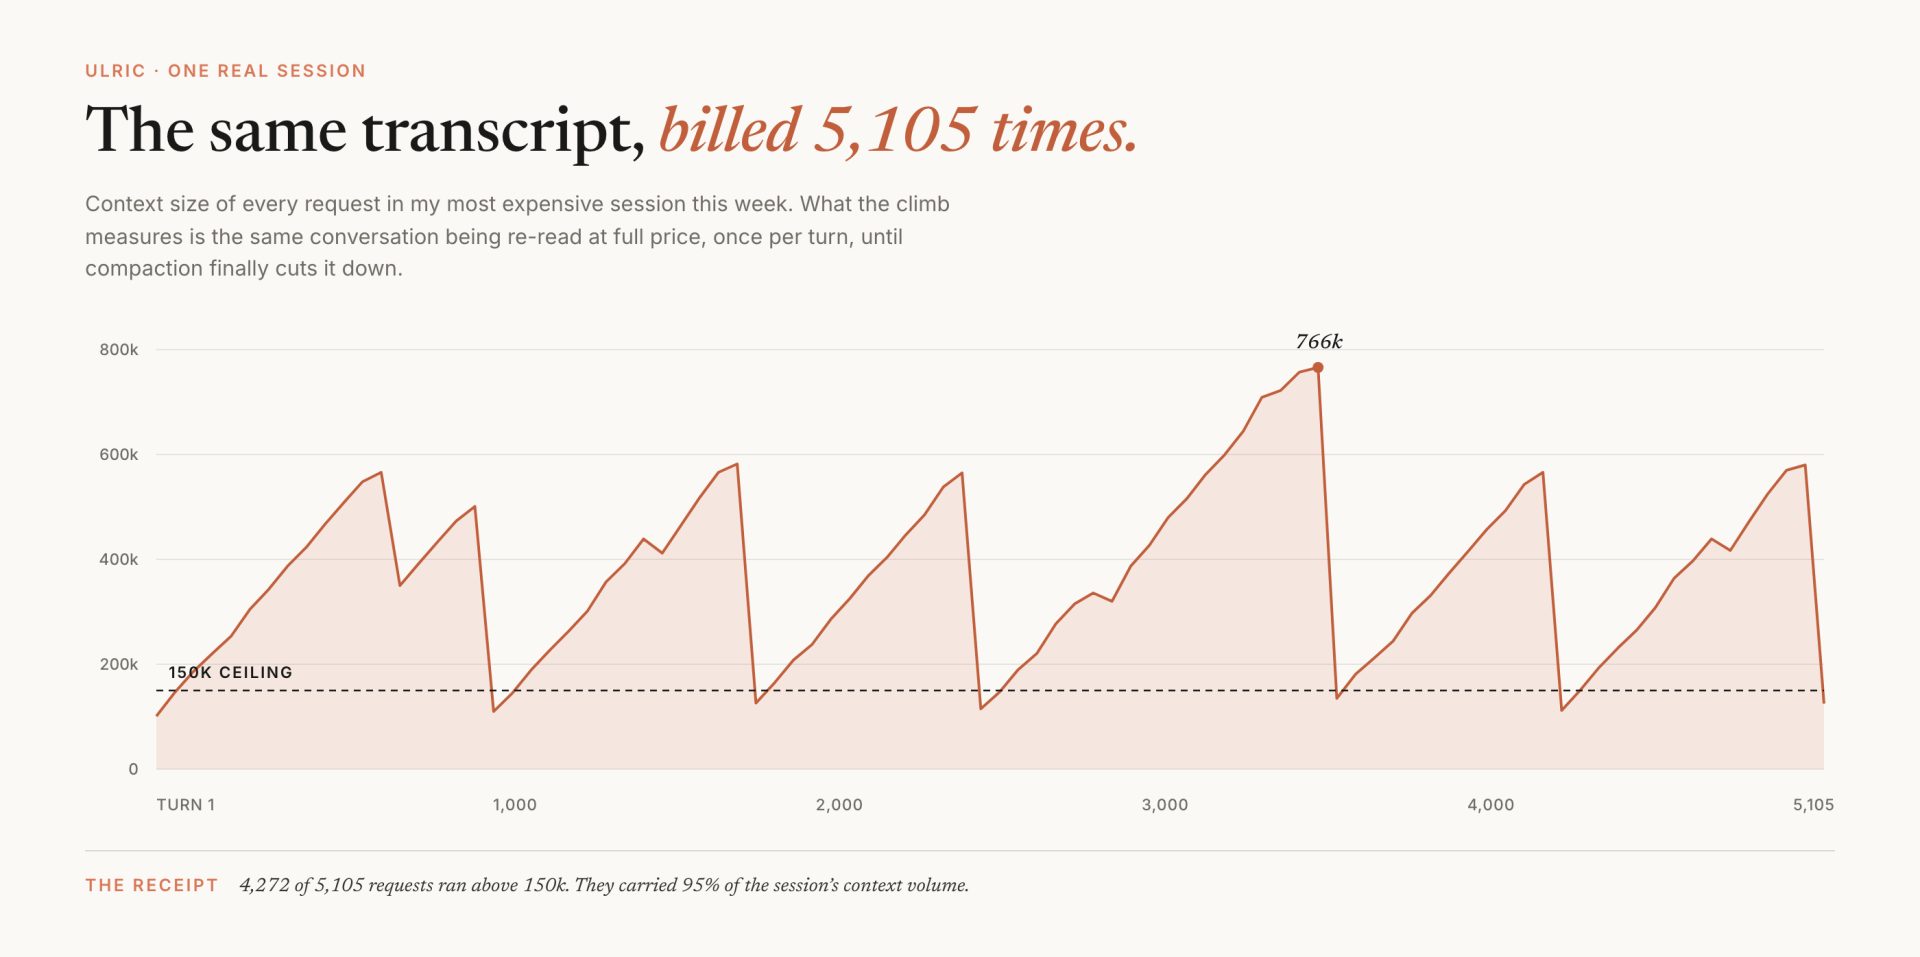
The shape of my worst session tells the rest of it. Five thousand one hundred and five requests in a single thread, context climbing from a hundred thousand tokens to seven hundred and sixty-six thousand, collapsing when auto-compaction finally fired, then climbing again. Six times. Four thousand two hundred and seventy-two of those requests ran above 150k, and they carried ninety-five percent of the session's volume. Compaction was working exactly as designed. It was simply arriving hours after the money had gone.
The panel was not wrong, it was aggregating
Every line in that dashboard is defensible. "Ninety-nine percent from subagent-heavy sessions" is a real number. It just attributes an entire session to a property of the session, so a nine-hour thread that spawned two helpers in its first hour files neatly under subagents. My ten most expensive sessions spawned none whatsoever. They were one model and me, alone, for thousands of turns.

Subagents accounted for 2.2 million of my 25.8 million output tokens. They are not free, and the place they actually cost something is startup: each one writes a fresh cache prefix before it does any work, and mine had written 255 million of those in a week because they were being spawned wide, carrying every tool in the box. That is a detail to fix, not a diagnosis to build a week around.
The expensive part of the expensive part
One thing I got wrong in the most costly way the tooling allows. Fable sits above Opus on price and carries its own separate weekly cap, and its own migration notes say plainly that it is not the default upgrade path, that it is meant for the hardest problems. I had been running it as an all-day workhorse inside nine-hundred-thousand-token sessions. Nobody sold me that idea. I assembled it myself, one convenient model switch at a time, and the two halves of the mistake were invisible to each other until they sat in the same table.
Three changes, all of them dull
Reasoning effort came down one notch from its maximum. The vendor's own guidance says the top setting makes the model explore more before answering, and that the level below is usually the better trade. Mine had been pinned at maximum since a hard debugging week months ago, when I set it once and never went back.
Then five standing agents, where before there were none. Not because delegation is virtuous, but because it is the only way to read something large without paying for it forever afterwards. An agent gets its own context, does the reading there, and hands back the paragraph that mattered. The bulk never enters the thread that has to live all day.

Each one carries a deliberately short tool list, which shrinks the prefix it has to write before starting. Routing is decided by volume rather than by difficulty: a thousand-line log is a large job and an easy one, and it belongs somewhere other than the thread I am trying to think in. Architecture, judgment, copy and design stay where they were, in the main thread, because those are the jobs where the accumulated context is the value rather than the cost.
Third, a rule in the global instruction file, since none of this enforces itself. Keep the working thread under 150k. Clear at task boundaries instead of letting one session change subject three times. Anything long gets read somewhere else and comes back as an answer. It is a close cousin of a change I made earlier the same day, when the harness cut its own rulebook in half on the grounds that a standing instruction is a tax collected before any work begins. Same family of problem, two orders of magnitude apart in what it was costing me.
What I am not claiming
I would like to finish with a savings figure. I do not have one, because the changes went in this afternoon and the only honest measurement is next week's, taken with the same script against the same files.
What I can put a number on is the diagnosis. Twenty minutes of counting JSON, against a dashboard recommendation I would otherwise have spent a week implementing in the wrong direction. That ratio is the whole lesson, and it is the same one underneath the SEO skill I built for the studio: a summary is not evidence. Instrumentation you can re-run yourself beats a figure computed for you, because when the figure surprises you, you can turn around and ask it why.
The script that found all this is about thirty lines of Python over files that were already sitting on my own disk. It had been possible the entire time. I just had a dashboard, and a dashboard felt close enough to knowing.
Related